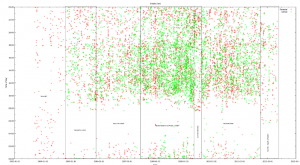
In passing I have seen several plugins/apps/sites that offer to retrieve your email history and present some sort of analysis. My wife mentioned this recently and I thought this idea sounded like fun so I did a little processing on my own email. I have email records going back to late 2003 – just about the time I started undergrad. So with some grep/java/gnuplot magic I present to you a graph of the timestamps for every email I have sent since then. I just processed sent emails because my behavior should be more evident than in received.
Analysis
The graph contains a red dataset – my personal emails and a green dataset – emails sent from my university account. The Y axis is time of day and the X axis is the date. Each dot is an email sent at that time on the given day.
Region-by-region
- The first region that you see is before I started logging school email. It just has personal emails… spanning all times of day/night. Seriously? I sent more email from 0000-0800 then 1600-2400???
- Second region introduces university emails. During this time I also worked for the university part-time 0900-1800. Nothing too surprising here.
- Third region is what I call early grad school. A general increase in both of my email volumes.
- Fourth region – the ASSERT period. The ASSERT project was a massive 2-2.5 year research lab project with a lot of people working on it and a lot of work. Check out the huge increase in school emails. I bet you could spot deadlines in there too.
- Fifth region – Summer internship
- Sixth region – Late grad school. Post-quals, post-course work, post-ASSERT, just relaxed set my own schedule time
- Final region – Real Job. Strict no-email hours, waking up early, less email, yup, that’s real life for ya.
Global observations
- Maybe I imagine it but I swear you see that the time that I start sending emails in the morning gradually becomes later and later — same for cease time. What/who is to blame? Grad school or my GF/fiance/wife?
- I sent more school email than personal: 5,164 messages to 4,849 messages
- You can vaguely spot summer breaks. Look for swaths of lower green density bordered by bursts.
- Sadly you can’t really spot certain events like: marriage, quals, proposal or defense.
Statistics
Number of emails sent per year:
| Year | Personal Count | School Count |
| 2003 | – | 57 |
| 2004 | 145 | 310 |
| 2005 | 412 | 310 |
| 2006 | 474 | 354 |
| 2007 | 728 | 815 |
| 2008 | 831 | 1,378 |
| 2009 | 804 | 1,140 |
| 2010 | 893 | 438 |
| 2011 | 438 | 464 |
| 2012 – to May | 68 | 59 |
