Ever since I started building this file server I have had the itch to benchmark the disk I/O operations so that I could get a feel for what kind of performance my users could expect. I was pleasantly surprised. If you want more information on the hardware used for configurations 1 and 2, take a look at my post where I showed the hardware list for the file server. In these graphs, the first column represents the hardware purchased for the file server. The second column represents the ‘high-end’ SCSI hardware RAID already in the server.
Configuration
I’ll give just a quick word about the configurations that are shown in these charts. Each group of bars in each chart represents a particular PC configuration. All of these PCs run Linux: Fedora Core 6/8 or CentOS 5.1. The top 3 graphs compare PCs using only their local hard disks (no network file systems). The furthest two bar groups on the right of these 3 graphs come from data on Virtual Machines. Finally, the third and sixth bar group in every graph have very suspicious data in my opinion. I ran the tests many times on these two configurations but never got consistent results from the tests. I have used the average of the test results where applicable and the data from the first and only run of the copy 1GB file test.
This table describes the parameters of the physical disks in each of the systems. The disk size for configuration 2 is correct in the table but incorrect in the label of the figures in this page.
| Configuration # (leftmost = 1) | Buffer Size | RPM | Size | Interface |
| 1 | 32MB | 7,200 | 750GB | SATA II |
| 2 | ? | 10,000 | 73.4GB | SCSI U320 |
| 3 | 8MB | 7,200 | 250GB | SATA I |
| 4 | 2MB | 7,200 | 40GB | IDE, UDMA 100 |
The data
Without further introduction here is the data. Click on each graph to see for yourself.
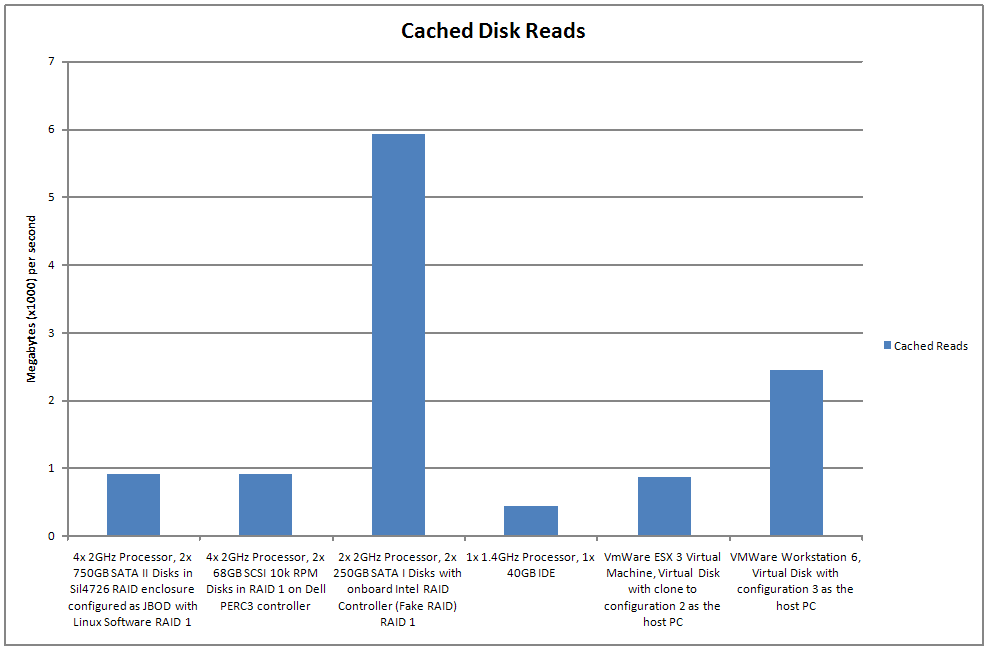
Cached Disk Reads
This test was performed by running:
hdparm -tT /dev/diskDevice
We can see that the third configuration has a very large number. I find this number suspect and untrustworthy. One of the reasons that I do not trust this data is because the following error message was printed during every execution of the test:
HDIO_DRIVE_CMD(null) (wait for flush complete) failed: Inappropriate ioctl for device
However, multiple runs of the test did not yield different results.
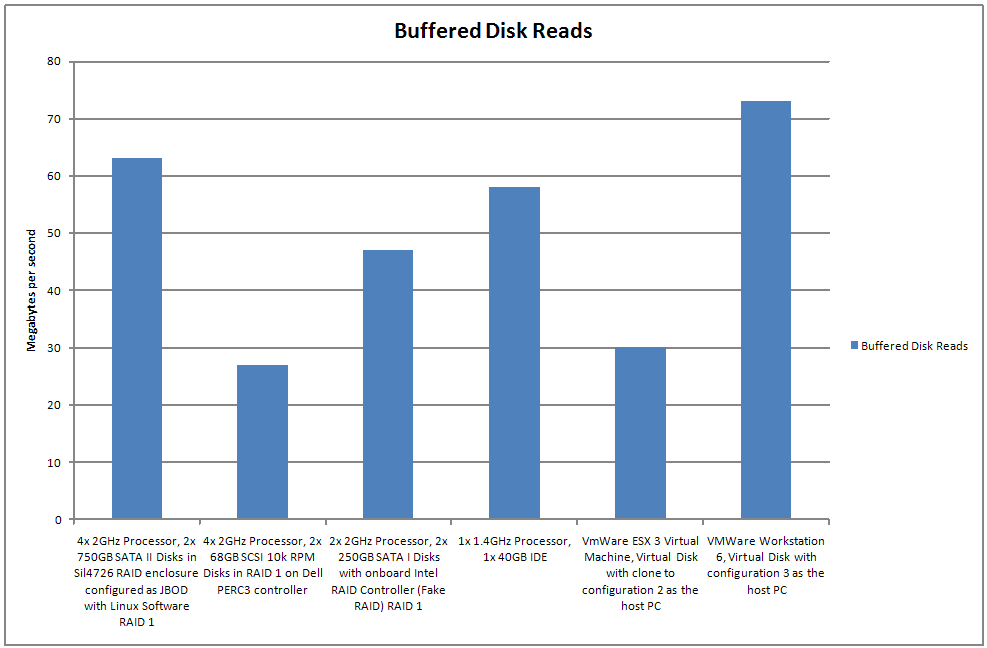
Buffered Disk Reads
This test was performed by running:
hdparm -tT /dev/diskDevice
There were no unexpected issues while gathering this data.
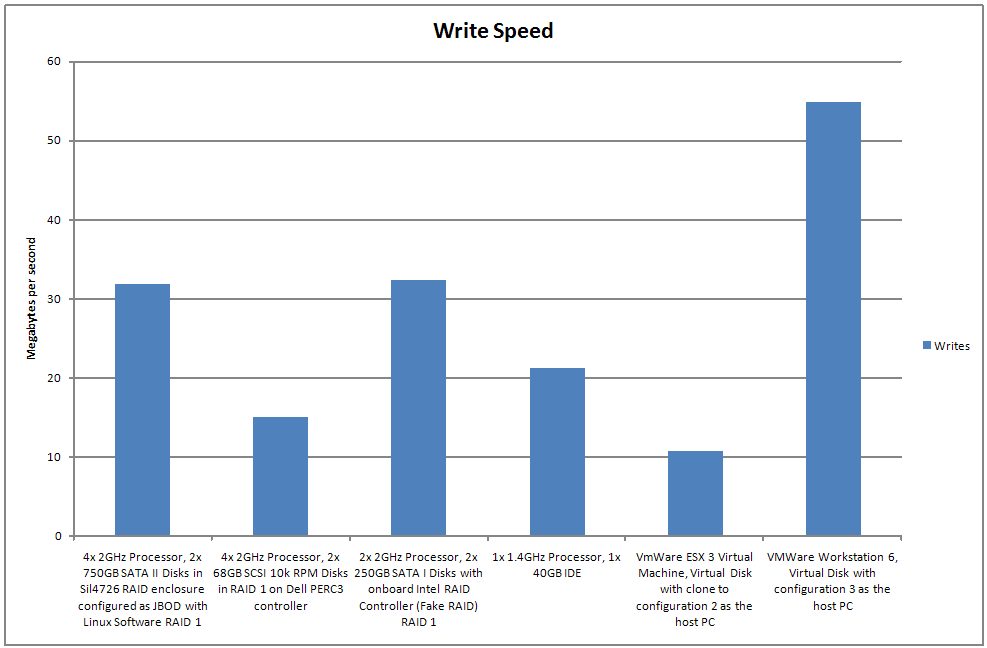
Write Speed
This test was performed by running:
dd if=/dev/zero of=localFile.txt
Once again the data in the far right column seems suspicious.
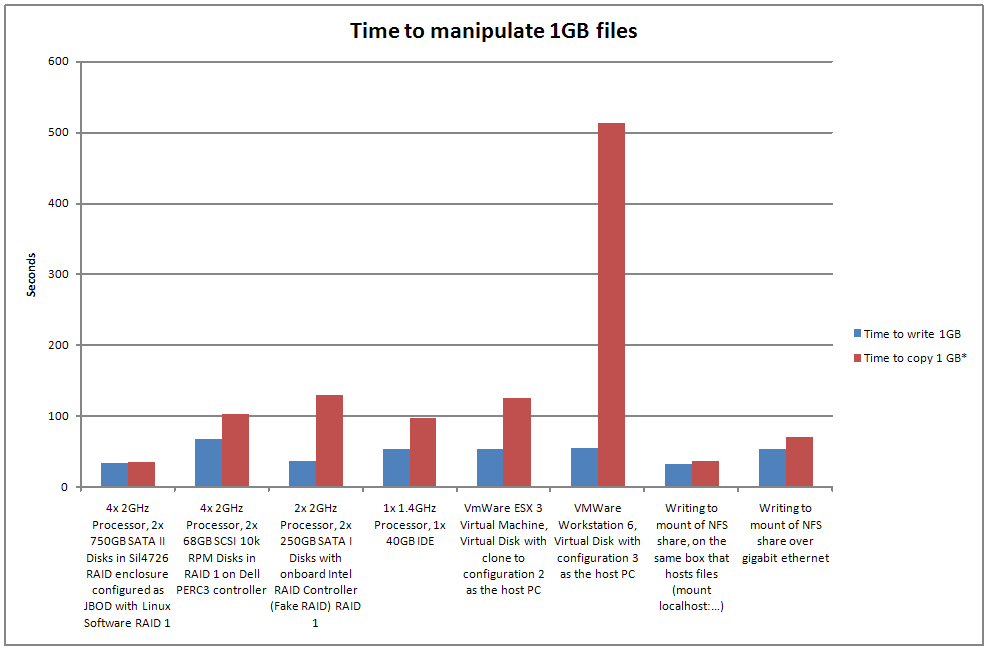
Time to manipulate a 1GB file
This test has two diagnostics:
1) Write a 1GB file in 1024B blocks using a custom program
2) cp fileA1GB.txt fileB1GB.txt # Copy a 1GB file
This test was extended to provide some very rudimentary information about the speed of these operations over a Gigabit ethernet network. The network filesystem was exported and mounted with NFS’ default parameters. This means that performance improvements could likely be attainable. Just a reminder, this graph measures time. Lower is better!
Sum it up
To sum it up, I’m quite pleased with the performance of this hardware for the file server. In some tests the hardware out performed much more costly hardware and in others was just beat by a hair. I think that most groups with a small number of users (<50) would have no complaints about this setup.


